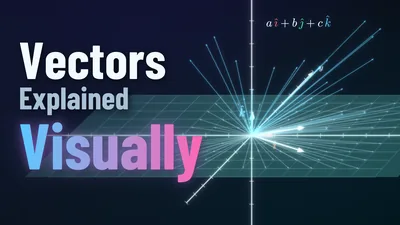
Animated explanations of the math behind economics and business — built so the idea arrives first and the formula second.
Six chapters so far, walking from ratios up through multivariable calculus and integration. One chapter, one way of seeing.
A video is a bad place to answer a specific question. These pages answer one each, with the answer up front.
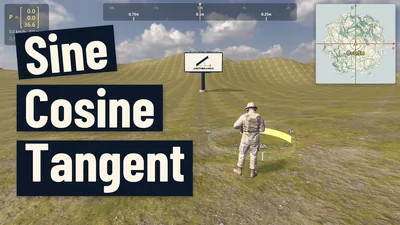
Type z = f(x, y) and a 3D island becomes that graph. Runs in the browser,
no install.
New series
A second series begins. Microeconomics is one question — how people behave when resources are scarce — circling a single word: efficiency. Chapter 0 draws the map of the whole forest before we walk into it, and the maths series becomes the toolbox it points back to.
The series
The minimum math you need, explained intuitively. Each chapter installs a schema — a way of seeing — rather than a procedure to memorise. They build on each other, but each one stands on its own.
Open World Discover
A 3D open world that runs in your browser, where the island is a function. Type
z = f(x, y) and the terrain becomes that graph — then drive, fly, or walk
across it.
Read instead of watch
You can't skim a video, and you can't quote one. So the ideas also live here as writing — one concept per page, with the answer in the first paragraph.